What Is Monte Carlo Simulation and Why Should You Care
Most financial models hand you one number and act like that settles it. Monte Carlo hands you ten thousand numbers, and that is actually the point.
Here is the thing nobody tells you when you start investing: when you buy a stock, you are not buying one future — you are buying exposure to every possible future simultaneously. There's the future where the company crushes earnings, the future where a competitor eats their lunch, and the future where some black swan event nobody saw coming wipes out the whole sector.
A single price target picks one of those futures and declares it correct. Monte Carlo simulation refuses to do that. It runs all of them instead.
The FatNarwhal Monte Carlo tool takes any stock you throw at it, simulates thousands of possible price paths going forward, and hands you back a picture of the full range of outcomes. Not a number — a distribution. You see the good scenarios, the bad ones, and where most of the paths actually cluster.
How to Use It
Head to fatnarwhal.com/tools/monte-carlo and drop in a ticker. Let's use NVDA, since everyone has an opinion on it.
The tool grabs the historical daily returns for that stock and estimates two things from them:
- Drift — the average daily return, or how much the stock tends to move upward on a typical day
- Volatility — how wild those daily swings get
From those two ingredients, it generates thousands of simulated price paths over whatever time horizon you pick — say, 252 trading days for a full year.
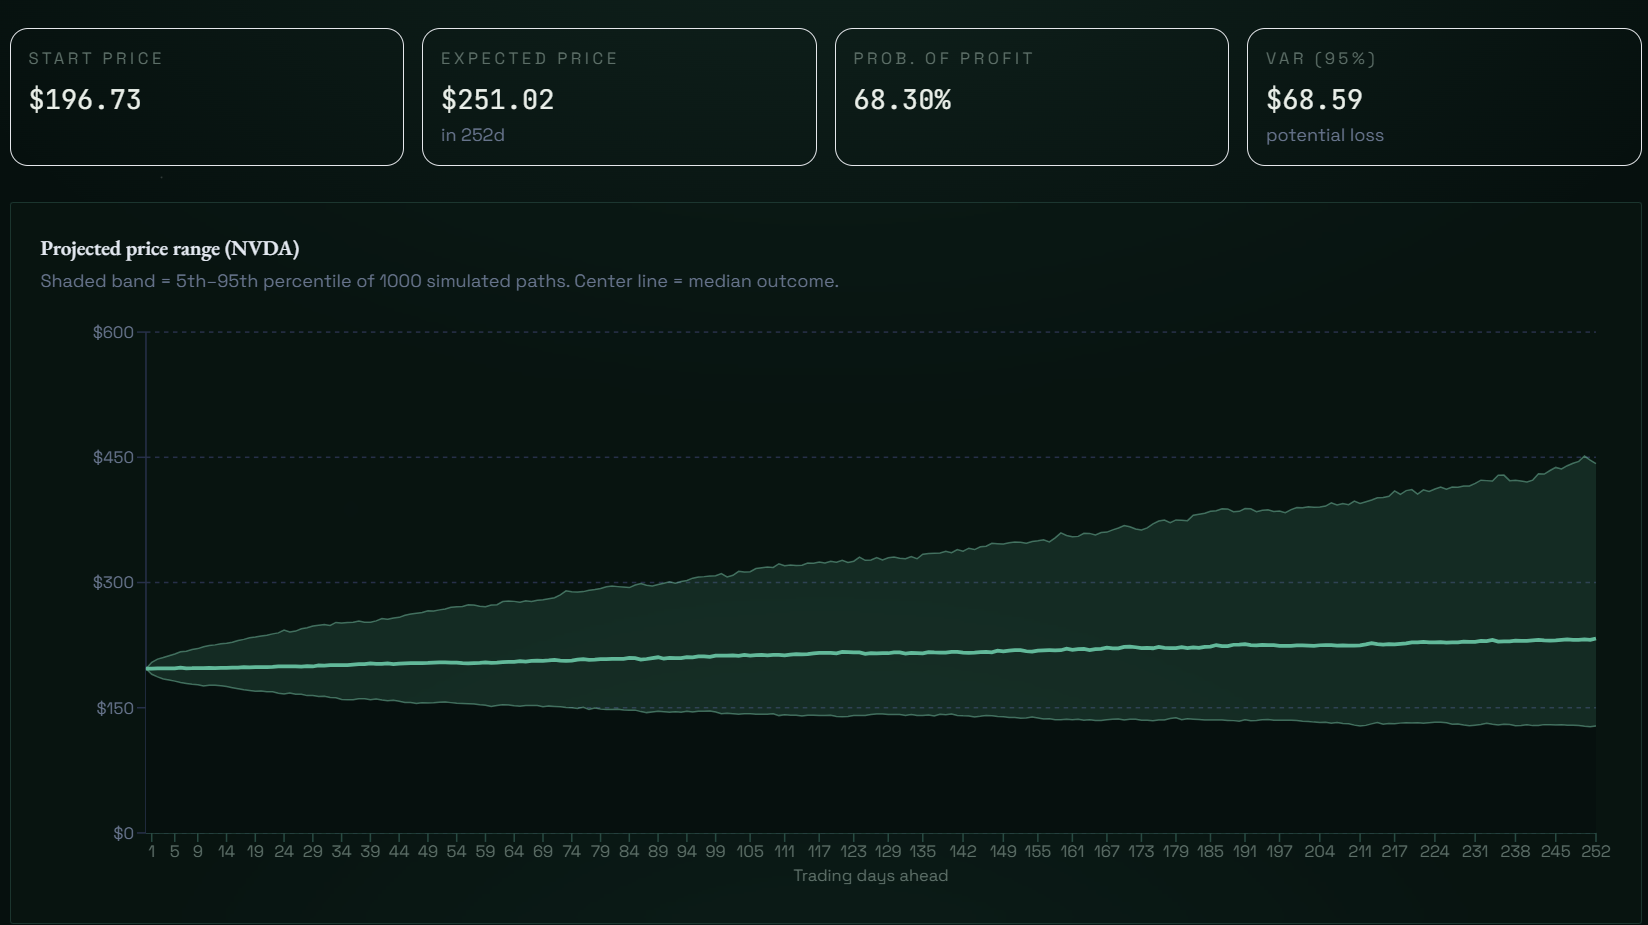
What you get back looks like someone threw a handful of spaghetti at a chart: thousands of lines all starting at today's price and fanning out in every direction, some shooting to the moon, some falling off a cliff, most landing somewhere in the messy middle. The shaded confidence band shows where 80% of the simulated paths ended up, and the median line shows you the middle-of-the-road outcome.
Try it with a sleepy, low-volatility stock like Johnson & Johnson, then switch to Tesla. The contrast is immediate — Tesla's fan of outcomes is dramatically wider, with far more upside, far more downside, and a lot more paths ending up somewhere nobody would have bet on at the start.
The Math Behind It
The model runs on Geometric Brownian Motion, the same framework underlying most of quantitative finance, including the Black-Scholes options pricing model. Each simulated step in a price path goes like this:
| Symbol | Meaning |
|---|---|
| Simulated price at step | |
| Estimated daily drift, pulled from historical returns | |
| Daily volatility | |
| Size of each time step (1/252 for daily steps in a trading year) | |
| A fresh random draw from a normal distribution — the digital coin flip that makes each path different from the last |
The term is called the Itô correction. Skip it and the model quietly overestimates returns, because of the way randomness compounds over time. It's a small adjustment that separates a real model from a subtly broken one.
Run the whole thing a thousand or ten thousand times and you get a distribution of where the price could land. That distribution is your Monte Carlo result, and it's a lot more honest than a single price target.
When to Use It — and When Not To
Reach for it when you want to:
- Understand the range of outcomes for a position rather than just the expected one
- Study the left tail — specifically, how bad the bad scenarios actually get
- Compare two assets not just on expected return, but on how wild their outcome distributions are
- Size a new position in a volatile name before you commit capital
Leave it on the shelf when:
- You're pricing in a specific catalyst, like earnings or an FDA announcement — historical volatility won't capture a known upcoming event
- You're tempted to treat the output as a price target. Monte Carlo distributes; it does not predict
- The stock has very little price history, which makes the parameter estimates shaky, and the simulation will reflect that
One more honest caveat: the model assumes returns follow a normal distribution, and real markets don't perfectly do that. Fat tails are real, crashes happen more often than a normal distribution would predict, and GBM misses sudden jumps entirely. Monte Carlo gives you a genuinely useful framework — not a crystal ball.
Try It
Run a simulation on any stock at fatnarwhal.com/tools/monte-carlo. Set a one-year horizon, run a thousand paths, and look at the 10th percentile outcome — that's your downside scenario, the one worth thinking hard about before you decide how much capital to put in.
The market gives you one future. The simulator gives you all of them.